Mit der Stratifizierungsfunktion der XL Toolbox können Sie Versuchssubjekte in Gruppen mit ähnlichen Eigenschaften einteilen. Die Subjekte (z.B. Mäuse, Ratten oder Menschen) können anhand mehrerer, frei zu bestimmender Parameter wie z.B. Gewicht oder Blutdruck den Versuchsgruppen zugeordnet werden.
Anwenden der Stratifizierungsfunktion
Sie müssen die folgenden Eingaben machen, um die Stratifizierungsfunktion zu verwenden:
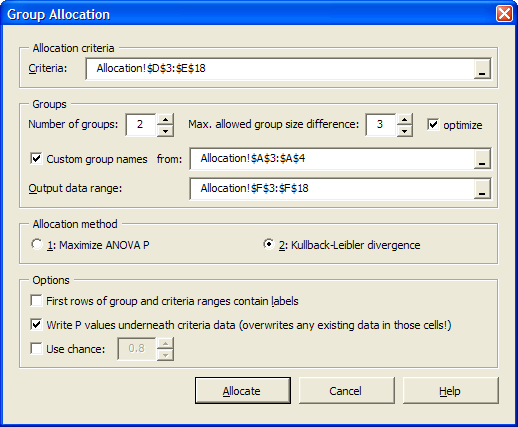
- Kriterien: Geben Sie hier den Zellbereich an, in dem die Eigenschaften der Versuchssubjekte (z.B. Körpergewicht) stehen. Es dürfen mehrere Eigenschaften in mehreren Zeilen/Spalten stehen.
- Anzahl Gruppen: Geben Sie an, in wie viele Gruppen die Subjekte eingeteilt werden sollen.
- Maximale Differenz der Gruppengrößen: Der Algorithmus versucht in erster Linie, Gruppen zu bilden, die sich in Hinblick auf die Kriterien ähneln. Das kann dazu führen, daß die Gruppen unterschiedlich groß sind. Sie können aber angeben, welche Differenz Sie maximal tolerieren wollen.
-
Optimieren: Wenn diese Option aktiviert ist, wird der Algorithmus intern verschiedene Gruppengrößen-Differenzen durchspielen, um möglichst gleiche Gruppen zu bilden. Die von Ihnen maximal erlaubte Gruppengrößen-Differenz (s.o.) wird am Ende immer eingehalten werden. Diese Option sollte immer aktiviert sein. Wenn Sie den Stratifizierungsvorgang beschleunigen möchten, können Sie sie ausschalten.
Optimieren funktioniert nicht, wenn Sie die Option Zufall aktiviert haben — Sie müssen sich also für eine Option entscheiden.
- Benutzerdefinierte Gruppennamen: Sie können hier einen Zellbereich angeben, der die von Ihnen definierten Gruppennamen enthält. Wenn die Option nicht aktiviert ist, wird die XL Toolbox allgemeine Gruppennamen (“Gruppe A”, “Gruppe B”) usw. verwenden.
- Algorithmus: Sie können zwischen zwei Algorithmen wählen, der für die Toolbox selbst entwickelten “ANOVA P”-Methode und der “Kullback-Leibler-Divergenz” (s.u.).
- Vor-Sortieren: Wenn diese Option ausgewählt ist, werden die Versuchssubjekte anhand ihrer Kriterien sortiert, bevor die Stratifizierng vorgenommen wird. Das führt im allgemeinen zu ähnlicheren Gruppen und sollte daher aktiviert sein; Vor-Sortieren verlangsamt jedoch den Prozeß etwas.
-
Zufall zulassen: Sie können hiermit angeben, daß die Toolbox nicht strikt nach Algorithmus alloziert, sondern ein Zufallselement einführt. Geben Sie hier eine Zahl zwischen 0,01 und 0,99 an. Ein Zufall von 0,8 bedeutet beispielsweise, daß ein Subjekt mit 80prozentiger Wahrscheinlichkeit der vom Algorithmus berechneten Gruppe zugeordnet wird; mit 20prozentiger Wahrscheinlichkeit jedoch nicht.
Zufall funktioniert nicht mit aktivierter Optimieren-Option — Sie müssen sich also für eine Option entscheiden.
- Erste Zeile enthält Beschriftungen: Diese selbsterklärende Option hat keine Auswirkung auf die Stratifizierung, sondern dient nur, die Auswahl des Zellbereiches etwas komfortabler zu machen. Falls Sie die Beschriftungen mit ausgewählt haben, aktivieren Sie einfach diese Option.
- P-Werte unter die Kriterien schreiben: Wenn diese Option aktiviert ist, werden die P-Werte einer Varianzanalyse unter den Zellbereich geschrieben, der die Kriterien enthält. So erhalten Sie einen Eindruck von der Effektivität der Stratifizierung. Je höher der P-Wert, desto unwahrscheinlicher ist es, daß ein Unterschied zwischen den Gruppen nicht zufällig ist. Beachten Sie, daß der Inhalt der Zellen, die unterhalb der Zellen mit den Kriterien liegen, ohne Rückfrage überschrieben wird.
Erklärung der Algorithmen
[Deutsche Übersetzung folgt.]
The Group Allocation function offers two different computation algorithms: The “Maximize ANOVA P” method and the “Kullback-Leibler divergence” method.
Both algorithms start by priming the treatment groups, i.e. they arbitrarily assign a certain number of subjects to the treatment groups. Then, they iterate through each of the remaining subjects and simulate assigning the subject to each of the treatment groups. From this simulation, the “best” treatment group for this subject is determined by computation, and subsequently the subject is assigned to that group.
Note: An important difference between the two algorithms is that the “ANOVA P” method can allocate any reasonable number of study groups. The “KLD” method on the other hand always allocates to two groups and allocation to a higher number of groups is achieved by recursing through previously allocated groups. Therefore, the “KLD” method can only allocate to 2, 4, 8, 16, … groups (power of 2).
Algorithm 1: Maximize ANOVA P
The “ANOVA P” algorithm work as follows: First, it arbitrarily assigns one subject to each group. Then, it iterates through the remaining subjects. Each subject is temporarily assigned to each study group, and the resulting p values of an analysis of variance for all allocation criteria are calculated. The p values are summarized for all criteria, and the subject is finally assigned to the treatment group that will result in the highest sum of P, but only if by assigning the subject to that group, the difference in group sizes does not exceed the user-defined limit (see above). If it does exceed the allowable size difference, the subject is assigned to the smallest group.
Algorithm 2: Kullback-Leibler divergence (KLD)
The Kullback-Leibler divergence (KLD) algorithm is based on a publication by Endo et al. (Contemp Clin Trials 2006;27:420, doi:10.1016/j.cct.2006.05.002).
It works as follows: First, it arbitrarily assigns two subjects to each group. Then, it iterates through the remaining subjects. Each subject is temporarily assigned to each study group, and the resulting KLD for the groups is computed. (A KLD is basically a measure for the difference between two distributions; read more in Wikipedia).
The subject is assigned the treatment group that will result in the smallest KLD, hence the smallest difference between the distributions.
This works only for two groups. If a higher number of treatment groups is needed, the function has to recurse through the previously allocated groups and split them in two. Therefore, the user-entered number of groups, when using the KLD algorithm, must be a power of two (2, 4, 8, 16, and so on).
Comparison of the two algorithms
It is up to the user to determine which algorithm works best for the task at hand.
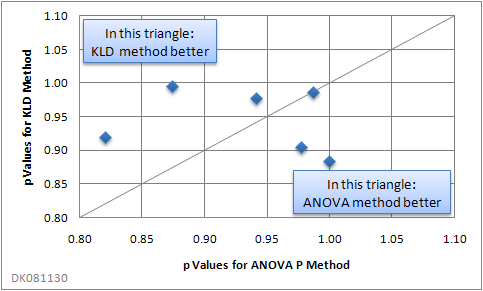
To get an idea how the algorithms compare, allocations with real subjects were performed. Data of 40 mice were entered into a spreadsheet, and the Group Allocation was performed six times with the two algorithms, using one criterion each time. The criteria were: Body weight, area under the curve for an insulin tolerance test, and relative fat mass. The number of treatment groups was “2” or “4”. The maximum allowed group size difference was always “2”.
The following figure shows the resulting six p values of an analysis of variance as a correlation of both algorithms.

When using two or more allocation criteria, there was a tendency for the “ANOVA P” method to yield better results:
| Algorithm that resulted in higher p values | |||
|---|---|---|---|
| No. of criteria | |||
| No. of groups | 1 | 2 | 3 |
| 2 | (None) | KLD | ANOVA P |
| 4 | ANOVA P | ANOVA P | ANOVA P |
Your results will vary, depending on your actual data.
Note that a high P value does not necessarily imply perfect distribution. P values derived from an ANOVA are the higher, the greater the variability within the groups compared with the variability of the group means is. Thus, an “ugly” distribution of data points within groups may result in a high P value, even though the allocation result is far from perfect. If perfect allocation, e.g. utmost equality of distributions in the groups, is important, it is recommended to compare both allocation methods with and without pre-sorting.
Limitations
There are a few limitations to both algorithms:
- Subjects are not permutated, i.e. the order of the study subjects matters. It is possible that group allocations is different if you change the order of your study subjects. (Version 2.10 of the XL Toolbox introduces the “Pre-sort” option that improves the allocation outcome.)
- You cannot use criteria with nominal data, e.g. gender or color names.
- The KLD algorithm only works with group numbers that are powers of 2 (for an explanation see above).
Group Allocation: A pracical example
Here is an example to illustrate the Group Allocation function with a practical example. Let’s suppose you have a large family of mice in your kitchen that you are friendly with and that agree to participate in a study. The study will involve dividing them in several groups that get fed one type of cheese; you measure their body weight, and at the end of the study you want to know which cheese makes the mice the fattest.
When assigning your friends to the “treatment” groups, you want to make sure that there are no differences in body weight at the outset. Also, because you know that some individuals generally eat more than others, you want your treatment groups to be similar with respect to the daily food intake.
First, arrange the data so that the body weights and the food intake are each in their own column:

Then, start the Group Allocator from the menu (Excel® 2003) or from the Ribbon (Excel® 2007) and enter the following parameters:

As you can see in the screenshot above, we have chosen in this particular example to make use of our own group names.
When you click on “Allocate”, the subjects will be assigned a “treatment”, in this example a type of cheese that they are going to eat in the study. The result looks as follows:

Since we chose to have the P values written underneath the columns that contain the allocation criteria, we can easily see how well the allocation worked. If there were absolutely no differences between the two groups, the P values would be 1. The body weights come quite close (p = 0.961), but the food intake data is not as well distributed.

Zitate
Kranz, L. M. (2016) Systemic RNA delivery to dendritic cells exploits antiviral defence for cancer immunotherapy. Nature.
Kreiter, S. et al. (2015) Mutant MHC class II epitopes drive therapeutic immune responses to cancer. Nature.
Framroze, B. et al. (2015) A Comparative Study of the Impact of Dietary Calcium Sources on Serum Calcium and Bone Reformation Using an Ovariectomized Sprague-Dawley Rat Model. Journal of Nutrition & Food Sciences, 5, 348.
